Step 2 · Validate · Trade Intelligence
See what happened the last 100 times.
Before you act, check how price moved after the most similar setups in the asset's own history.
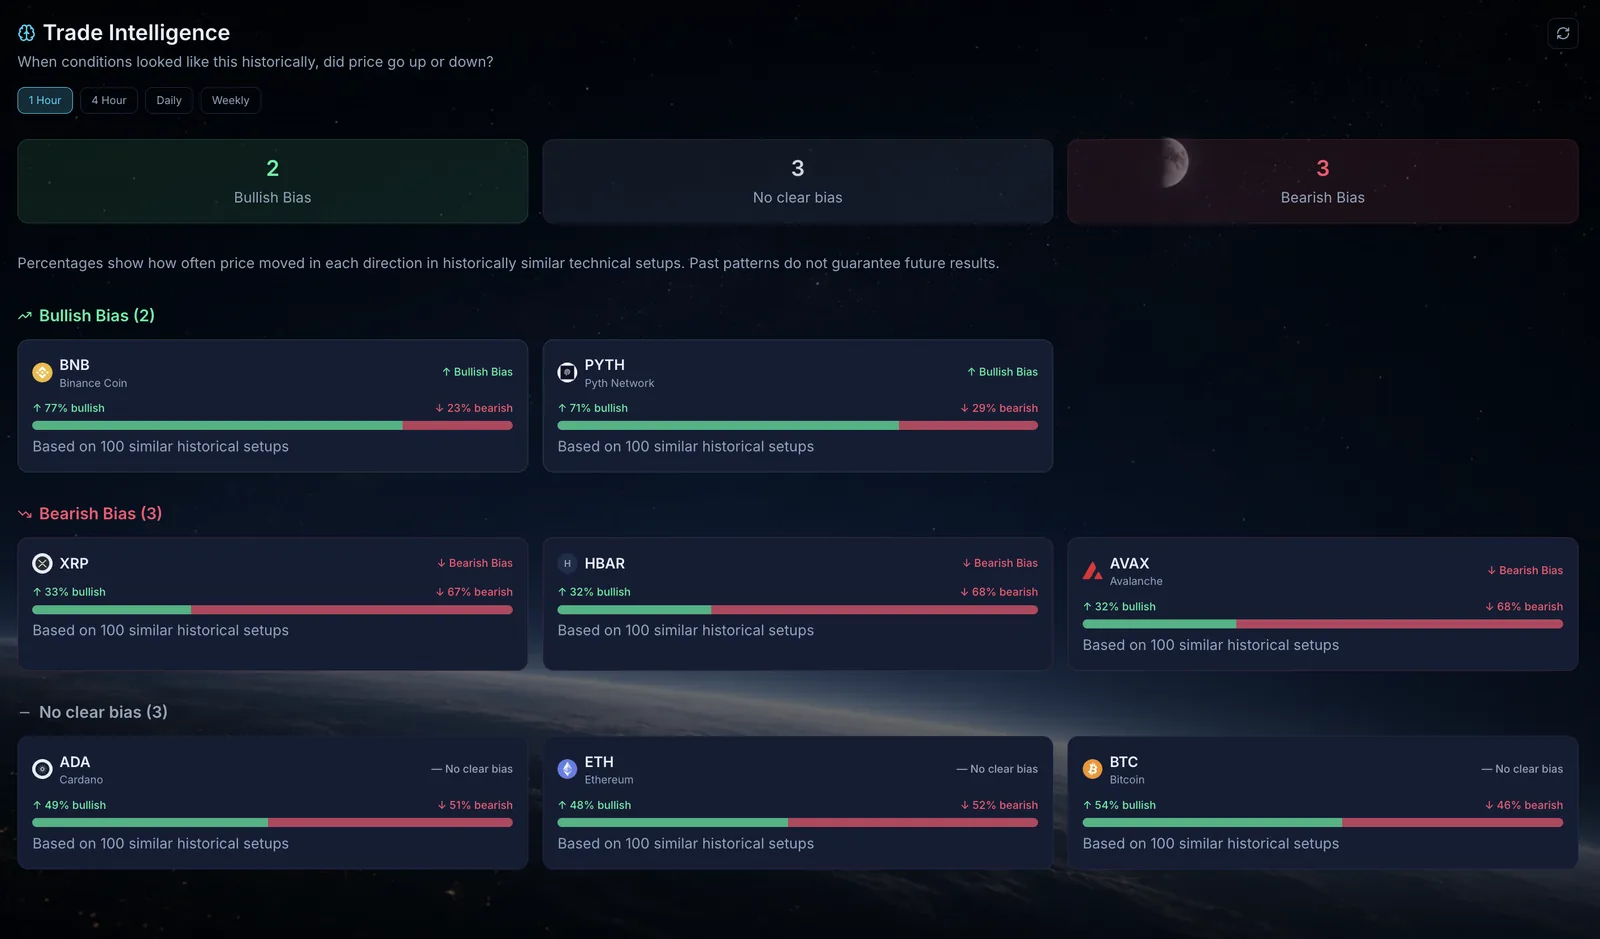
Bullish bias, bearish bias, or no clear bias.
Assets are grouped by how often price went up or down after similar setups.
Based on 100 setups.
Each reading shows the split, such as 71% up and 29% down.
On your timeframe.
1-hour, 4-hour, daily and weekly.
Example
Your asset reads Bullish on the gauge, but Trade Intelligence shows no clear bias on the same timeframe. That's a reason for caution, or a smaller position.
Questions
What counts as a similar setup?
Past moments when the asset's technical conditions looked most like they do now.
Does a 70% bullish reading mean price will rise?
No. It shows what happened before. Past patterns do not guarantee future results.
Next: Step 3 · ResearchAlfaDesk
Your decision, better informed.
Start TodayAlfaHedge provides market information and decision support, not financial advice.