Step 1 · Find · Opportunities
Find the strongest setups in minutes.
Every asset we track, scored on one gauge from Bearish to Bullish, with whether it is improving or worsening.
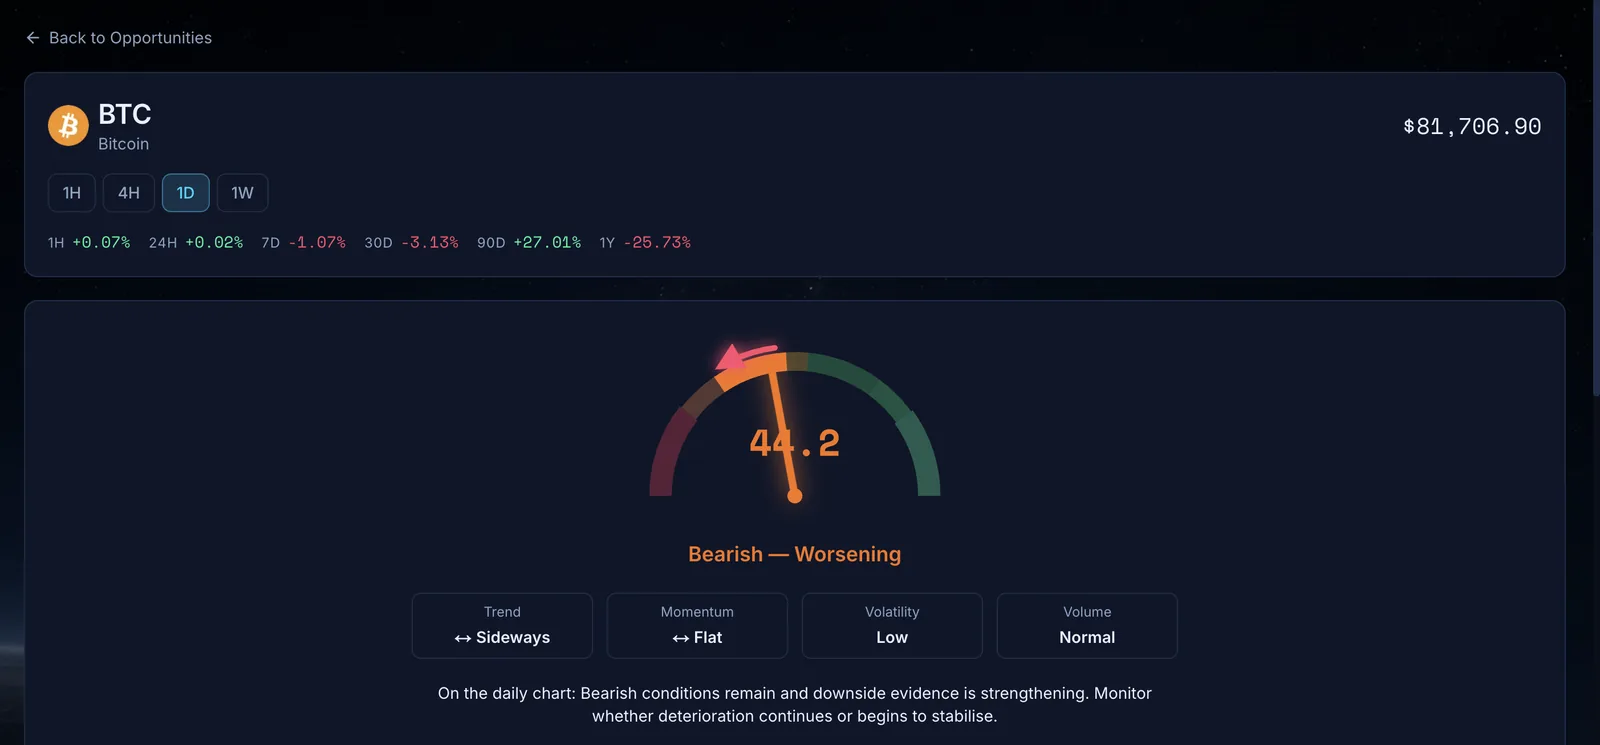
One gauge, seven bands.
From Bearish to Bullish, with "Improving" or "Worsening" so you see the direction, not just the level.
Your timeframe, your style.
1-hour, 4-hour, daily and weekly readings, for day, swing and trend traders.
Why it reads that way.
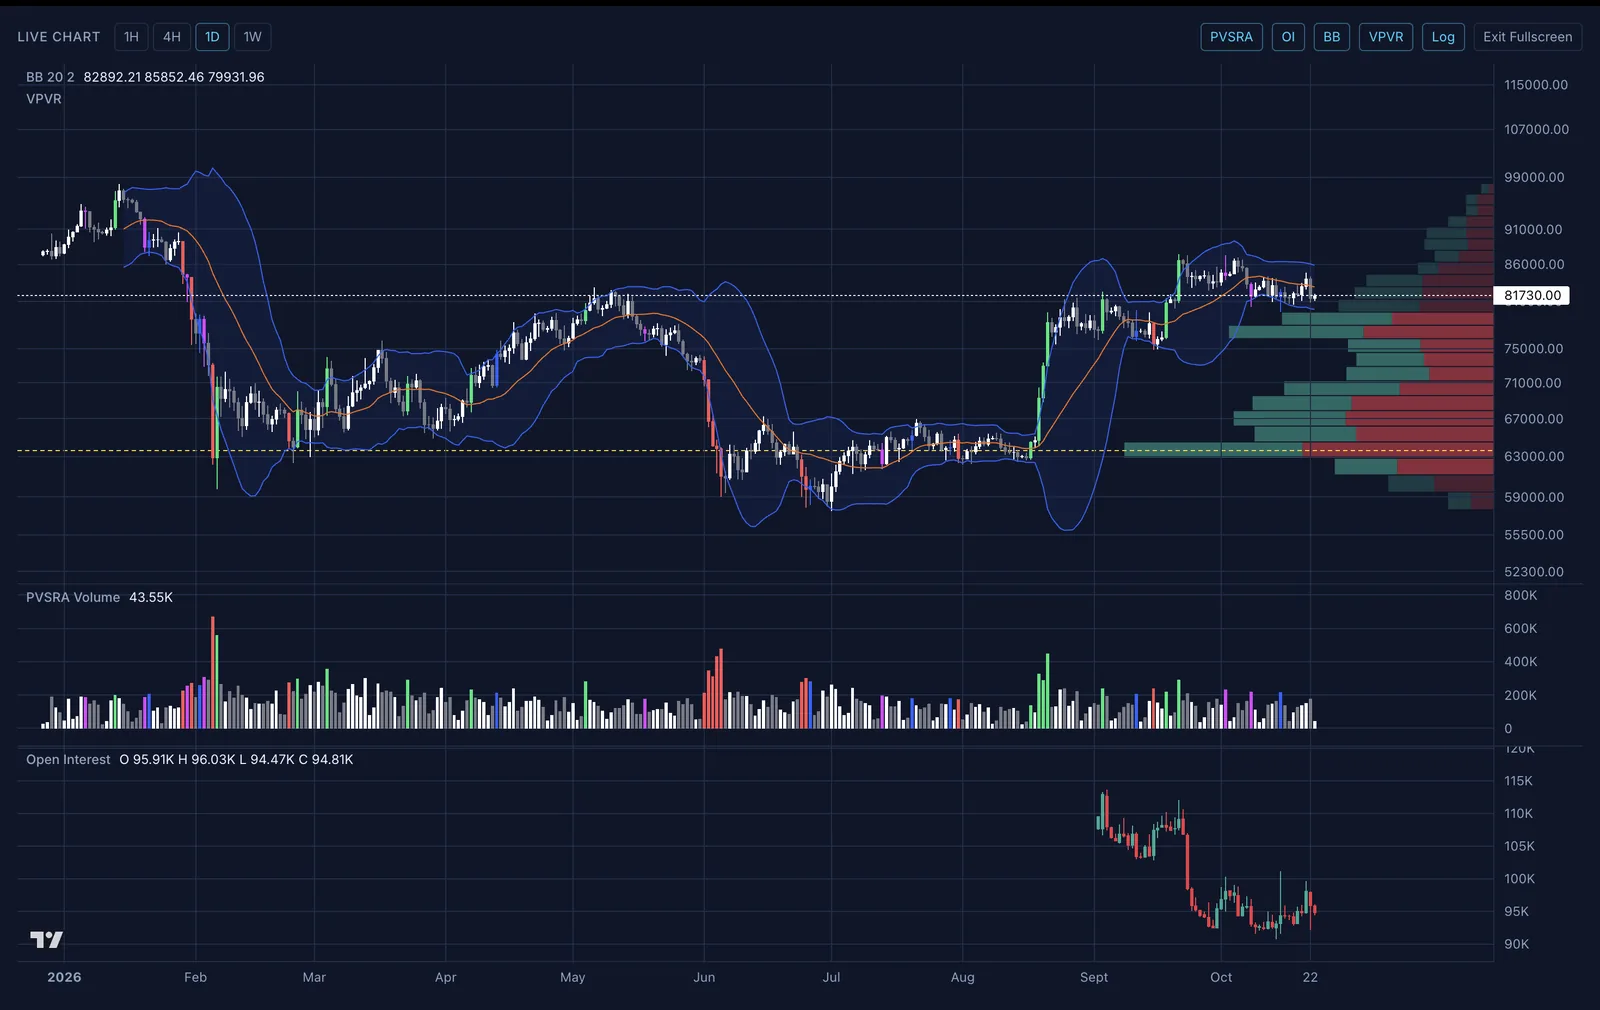
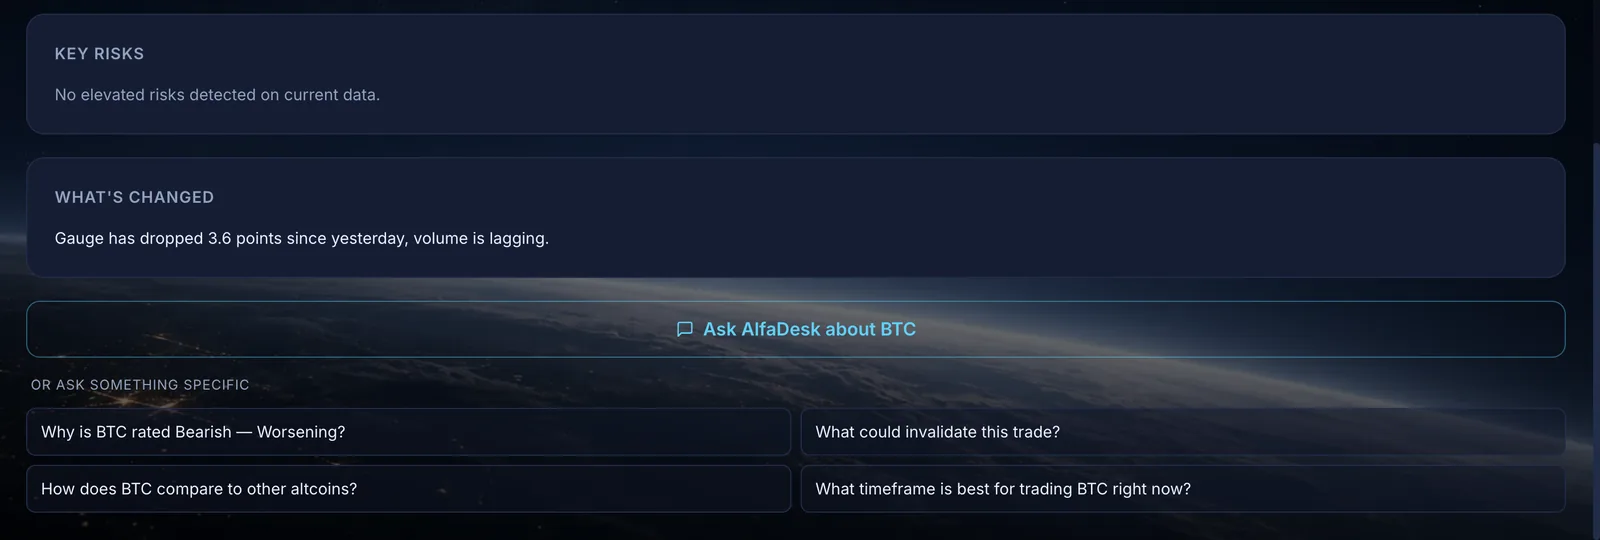
Each asset page shows trend, momentum, volatility and volume, what has changed since yesterday, and a live chart.
Example
On the daily chart, filter to Bullish and sort by score. Open the top asset and check that trend and momentum agree before you go further.
Questions
Can I see it without an account?
Yes. Visitors see the daily Swing Trader view. Join free to switch timeframes and track your own list.
What does the gauge combine?
Trend, momentum, volatility and volume, read together into one score.
Is a Bullish reading a buy signal?
No. It shows conditions now. The next steps help you check them.
Your decision, better informed.
Start TodayAlfaHedge provides market information and decision support, not financial advice.